A Summer 2023 Update on Divvy’s Bidding Strategy
We’ve continued to closely watch the market and still see many of the same fundamentals at play as we did when we initially published this update. As of now, we are maintaining that strategy for the near-term, but planning for a shift in strategy as soon as market fundamentals allow. We feel that maintaining this bidding strategy is necessary to increase the likelihood that the homes Divvy buys will be priced to the future market and will appraise when residents are ready to exercise their option to purchase the home from us.
As the state of the US housing market continues to dominate daily news cycles, Divvy has been actively working with economists and financial experts to refine our strategy for buying homes in a way that will best position our customers for long-term success.
Here, we share our insights on the housing market, how we plan to adjust for the changing market conditions, and our optimism for the opportunities that exist today and in the future.
While home prices today are still up year-over-year, the rate of home price appreciation has slowed significantly, and in fact, prices are down from the peak reached earlier this year, by more than 10% in some markets.1 While the pace and severity of the decline will vary by market, we believe that home prices are likely to decline another 5-15% over the course of the coming months. In light of this, Divvy is planning to bid more conservatively on homes, likely 10-20% below list price depending on the market.2 We cannot guarantee what the future holds, but we feel that this shift in our bidding strategy is necessary to increase the likelihood that these homes will appraise when our customers are ready to exercise their option to purchase the home from us.
Over the medium- and long-term, we continue to be bullish on the housing market: the fundamentals continue to be strong, with constrained supply and supportive demographic trends, and we are confident that once the macro stabilizes, home prices will recover.
Below are answers to some questions you may have — we hope our answers provide additional insight into our thought process. We know this change in strategy will be challenging at first. However, we hope you can bear with us as we all try to navigate through a volatile, but hopefully brief, period in the housing market. Although the path seems uncertain at present, we remain focused on our goal of helping our customers on their journey towards homeownership.
Are we still buying homes?
Yes!
We are still committed to buying homes on behalf of our customers. In doing so, however, we want to set both our customers and Divvy up for success by bidding at levels that reflect the current state of the market and where we think home prices are headed.
Why are we bidding below list prices?
We set our option price (the price at which a customer can purchase the property from us) above the price that we offer the seller on the home. Assuming home prices continue to decline, we need enough margin of safety so that the customer’s option price can still appraise when they get a mortgage, and they can ultimately purchase the property, even in a volatile home price environment. A home not appraising is a lose-lose situation for our customer and for us that we work hard to avoid.
In addition, a customer’s ability to qualify for a mortgage is based on a payment-to-income (PTI) ratio — the combination of higher interest rates and higher home prices have pushed PTI ratios to historically high levels (more on this below), meaning even well-qualified buyers are being priced out of the market today. Again, we want to do what we can to ensure our customers are set up for success: bidding more conservatively on homes means that the PTI ratio will be more within reach when the customer is ready to purchase.
What makes us think home prices are going to decline?
We can’t predict the future, but we have spent a lot of time with economists, studied the data, and come to the conclusion that we believe home prices will decline in 2023 due to lower consumer demand. This isn’t really surprising, as the cure to inflation is a decline in consumer spending, of which housing is the largest share of the consumer wallet. Said differently, the government has been trying to reduce consumer demand, including for housing, and we think it is working. Here is our rationale:
1. Housing affordability is at a 40-year low
As seen in the chart below, the average payment-to-income ratio3 spiked to 39% in September 2022, almost 2x higher than the 20-25% PTI levels between 2012 and mid 2021, due to a combination of higher home prices and higher interest rates.
Home prices have seen a steep increase since the end of 2019, having appreciated by 40-50% in most markets over that timeframe. That represents an annual increase of roughly 15%, which is more than double the long-run average.4
The Federal Reserve Bank (the “Fed”) has increased interest rates in order to combat significantly higher inflation, pushing 30-year mortgage rates up nearly 125% since the beginning of 2022 (3.15% to 7.00%+). To illustrate the effects of the rate increases, let’s look at monthly payments on a $400,000 home:
At the end of 2021, 30-year mortgage rates were ~3.15%. Assuming a 3% down payment, the monthly payments would be about $2,000/mo. The monthly payment for the same house, with home prices up 15% and mortgage rates at 7.0%, would be ~$3,300/mo – a 65% increase in payments! Over the same period, wages increased just 5.1%,5 which led to the staggering doubling of PTI ratios noted above, putting mortgages — and homeownership — out of reach for a huge portion of Americans.
We have not seen ~40% payment-to-income levels since the early 1980’s, when the US was coming out of another period of sustained inflation. Between 1978-1982, the severe reduction of mortgage affordability led to a 50% reduction in home sales.6 While we do not expect that degree of a correction (mortgage rates peaked in 1981 at 18.5% in 1981, compared to ~7.25% today), we have seen a dramatic reduction in volume of home sales and, as a result, we have seen and expect to continue to see home price declines.
2. Consumer balance sheets are under pressure
Most economic data suggests fewer consumers will have down payment savings, resulting in less demand, which ultimately puts further downward pressure on home prices. The consumer personal saving rate has declined to 3.1%, the lowest level since 2008.7 The drop in savings is largely due to wage increases not keeping up with inflation, causing Americans to spend more of their paycheck to purchase the same amount of goods and services they previously had. Additionally, consumer credit card balances increased $100 billion, or 13% between August 2021 and August 2022, the biggest increase in over 20 years, as consumers are having to rely on debt to pay for household expenses.
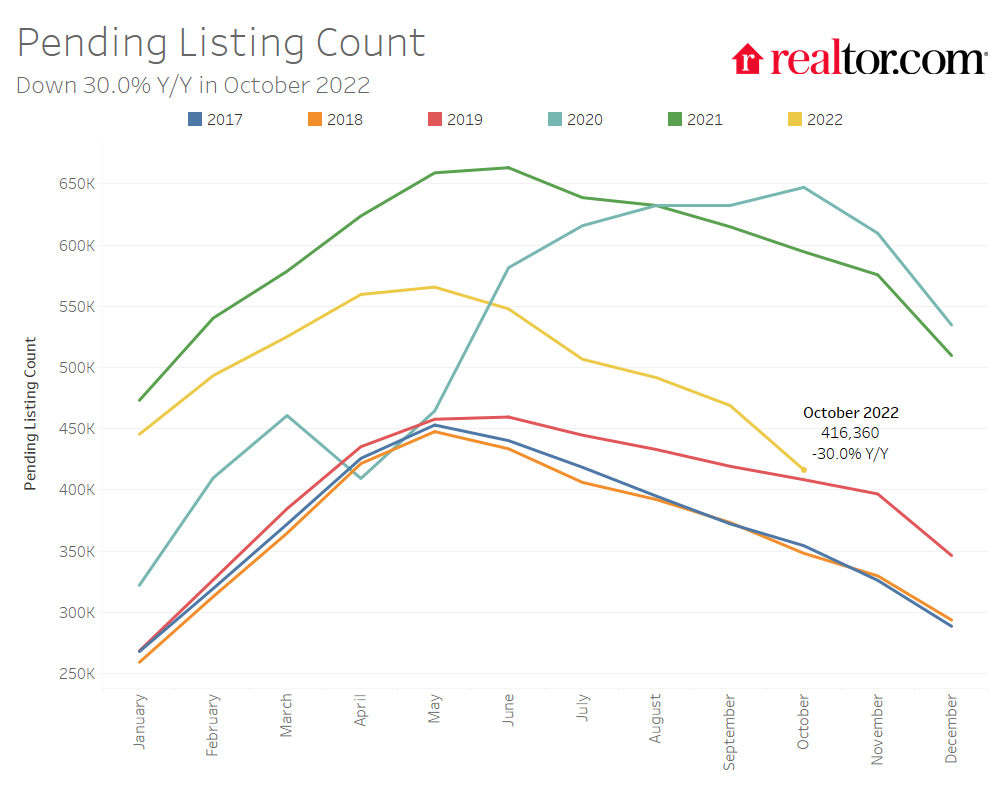
3. Inventory is increasing, but primarily due to reduced buyer demand
Reduced buyer demand is the main driver of increased supply, depicted through reduced pending sales, which are down 30% year-over-year. The softening in demand is represented by the uptick in days on market (DOM), which is now averaging 51 days, up ~13% year-over-year.8 Again, while increasing DOM is not a perfect correlation with declining prices, this does suggest that demand is softening, signaling a weakening of the housing market.
4. Fewer institutional buyers, lower bid prices and reduced purchases
In recent months, most institutional buyers of single-family homes have dramatically curtailed or completely halted new purchases: Tricon9 and Invitation Homes,10 two of the largest public SFR REITs, both stated during their Q3 earnings calls that they are materially slowing home acquisitions due to volatile market conditions. Many other institutional buyers are following suit, waiting for rates to stop rising and home prices to fall. Those that remain active have been purchasing homes at a significant discount — approx. 91% of list price, based on available data. This drop in bidding represents about a 10 percentage point reduction in bidding aggression from April.
5. Home prices have started to fall, but prices remain elevated
Home prices are still up ~10% year-over-year (i.e. October 2022 v. October 2021), however home price depreciation is already being reported nationally with prices falling nearly 2.5% over the past 3 months.11 Most research analysts are expecting home price depreciation anywhere in the range of 5-10% for 2023. John Burns Real Estate Consulting group is on the more bearish end of the spectrum, projecting 12.6% home price depreciation nationally; others (Morgan Stanley, 7%; Goldman Sachs, 5-10%; and Wells Fargo, 5.5%) are forecasting slightly less depreciation, but the consensus view is fairly well established at this point: home prices will depreciate in 2023.12
Are we worried about the long-term outlook for the housing market?
No.
We’re actually quite optimistic about the balance that will return to the housing market. No more blind offers before the home is even listed… No more waived inspections… No more ‘investor specials’ over the asking price… Relief! Furthermore, the medium- to long-term fundamentals of the housing market remain extremely strong.
1. This is not 2008
We understand that real estate is cyclical and we are currently in the downward part of a cycle. That said, we do not believe this current cycle will look anything like the Housing Crisis of 2008. Lending limit laws enacted after the 2008 Housing Crisis have been working to reduce overall borrowing exposure to the system. As of October 2022, approximately 50% of homeowners had a loan-to-value of 50% or lower, in other words, half of the homeowners in the US own 50% of their home value.13 As a result, we do not expect to see mass forced selling like we did between 2008-2010 — when many consumers had little to no (and in some cases, negative) equity value in their homes due to excessively loose mortgage underwriting — which led to 20-40% reduction in home prices.
There have only been 257,215 foreclosures filed so far in 202214 (a run rate of ~343,000 foreclosures annually15). For context, there were more than 1 million foreclosures each year between 2008 and 2012.16
2. Housing shortage likely to persist with lack of new listings hitting the market
The majority of homeowners today are locked into very favorable interest rates. Approximately 85% have mortgage rates below 5%, 65% below 4%, and 24% below percent below 3%.17 Naturally, these homeowners will want to avoid selling their homes in a high-interest-rate environment, unless a recession does take hold and people are forced to sell after a loss of income.
As of October 2022, new listings are down 15.9% year-over-year,18 which implies that (i) sellers do not want to move, because they like their existing monthly mortgage payment locked in when mortgage rates were low, (ii) sellers cannot move, because they cannot afford another house or higher mortgage rates, or (iii) a combination of both.
3. Home Builders slowing pace of construction
As of October 2022, builders have reduced housing starts by 51% year-over-year and are continuing to cut back on production in order to keep excess inventory off their balance sheets.19 This is in response to an average cancellation rate of 26% on new contracts, compared to just 7.9% just a year ago.20
For context, cancellation rates reached as high as 40% during the peak of the 2008 Housing Crisis; keep in mind, however, that was following a period of significant over supply.21 Also, approximately 63% of builders surveyed by John Burns in Oct ’22 reduced net prices on their homes in order to appeal to more buyers.22
As builders look to navigate the evolving housing market, their main lever is to slow production until buyer demand begins to rise again.
What signals are we monitoring to know when the housing industry has stabilized?
As we’ve discussed throughout, we are expecting home prices to correct in order to reflect reduced demand and higher borrowing costs. We are closely monitoring data for signs of stabilization in the housing market, which we believe will be reflected in the following:
1. The Fed signals a slowdown in rate hikes
As of today, inflation is still not completely under control. Therefore, the Federal Reserve has not yet indicated that they intend to slow the pace of interest rate increases. We are not certain where interest rates will peak, but most market participants believe the Fed will continue increasing rates through February 2023 and perhaps longer. That said, once the Fed pauses or slows rate hikes, we expect mortgage borrowing costs to stabilize and begin to normalize. The reduced borrowing costs will bring more homebuyers back into the mix, creating a more balanced market.
2. Risk spreads begin to normalize
The historical relationship between mortgage rates and treasury bonds (the “risk spread”) has been remarkably stable: between January 2009 and June 2022, the risk spread averaged 1.70%, and was only >2.5% for 4 months (during the early months of COVID); currently, however, the spread is above 3.00% and has spent most of the second half of 2022 above 2.5%. That risk spread is an indication of lenders’ bearishness about the housing market and interest rate movements; as this begins to normalize, it will show that banks are willing to lend again.
3. Inventory stabilizes
Supply will likely continue to grow before it stabilizes, and in order for there to be a balanced market, the growth also needs to come from new listings. Right now, most of the supply is driven by reduced demand (i.e. homes are taking longer to sell). At the end of October, there were approximately 750,000 homes for sale, up from 400,000 homes in January. In the pre-pandemic era average active listings were remarkably stable, ranging from 1.1-1.2m between 2017 and 2019, and never dipping below 1m. While there is no magic number per se, we believe that active listings increasing to over 1m is a good indicator of a balanced market. We believe this will happen in 2023. Equally as important, we need to see demand return in order for there to be a stable, balanced market, with most active listings coming from new rather than stale listings. Demand will be a function of interest rates, mortgage affordability and availability, and home price rationalization.
4. Affordability improves; Payment-to-Income ratios fall below 30% again
In order for affordability to get to 2018 levels, which we are using as a proxy for a balanced market, we need to see a 20+% reduction in home prices, a ~350 bps reduction in interest rates, or (more likely) a combination of those two factors. Once interest rate hikes have slowed, and buyers and sellers return to the market, we believe inventory will reach 2018-2019 levels. Reduced borrowing costs and lower home prices will make homes more affordable, bringing much needed balance back to the housing market
Appendix
October 22: Newly Listed Homes (source: Realtor.com)

October 22: Active Listing Count (source: Realtor.com)

October 22: Pending Homes Count (source: Realtor.com)

Payment-to-income ratio vs. 30-year Rates (source: Black Knight)

Black Knight’s Home Price Index, starting from 2002 (source: Black Knight)

Average Close Price Relative to List Price for single-family institutional REITS (source: Divvy Research; based on MLS acquisition data for SFR REITs including Invitation Homes, American Homes 4 Rent, FirstKey, Progress, Mainstreet Renewal, Starwood, and Tricon)

Average Builder Cancellation Rates (source: John Burns Real Estate Consulting September 2022 survey)

1 “98 of the 100 Largest U.S. Markets Saw Home Prices Decline in September From Their 2022 Peaks”, October 31, 2022. (data from Knock via PR Newswire)
2 Divvy’s bidding strategy as it relates to a particular home is highly data dependent and varies based on many factors, including by region. Because of this, Divvy does not represent that this bidding strategy will apply uniformly to its homes and retains the discretion to bid on a price outside of this estimated range.
3 The National Payment-to-Income Ratio is the share of median income needed to make the monthly principal and interest payment on the purchase of a home (Black Knight)
4 Case-Shiller US National Home Price Index (via FRED)
5 Employment Cost Index – September 2022 (Bureau of Labor Statistics)
6 The inflationary dynamics of the early 1980s were far more severe, and the impact on wages and home price appreciation was quite different, than what we’re seeing currently. We believe, however, that the dramatic reduction in home sales due to a severe restriction of mortgage affordability is instructive for the current market.
7 U.S. Bureau of Economic Analysis: Personal Savings Rate (via FRED)
8 October 2022 Monthly Housing Market Trends Report (Realtor.com)
9 Tricon Q3 2022 Earnings Transcript (Seeking Alpha)
10 Invitation Homes Q3 2022 Earnings Transcript (Seeking Alpha)
11 Black Knight’s Mortgage Monitor Sep 2022 edition (Black Knight)
12 “Where is the housing market headed in 2023? Here are the predictions” (collated by Deseret News)
13 “Homeowner Equity Keeps Growing Across U.S. In Third Quarter Despite Housing Market Slowdown” (ATTOM)
14 “U.S. Foreclosure Activity Continues to Increase Quarterly Nearing Pre-Pandemic Levels” (ATTOM)
15 Annual foreclosure run rate calculated utilizing foreclosure totals from Q1-Q3 2022 (ATTOM)
16 “Increased Foreclosure Activity in First Six Months of 2022 Approaches Pre-Covid Levels” (ATTOM)
17 Deputy Chief Economist, Odeta Kushi, at First American
18 October 2022 Monthly Housing Market Trends Report (Realtor.com)
19 John Burns Real Estate Consulting (October 2022)
20 John Burns Real Estate Consulting (October 2022)
21 Months’ Supply of New Homes in the US (via FRED)
22 John Burns Real Estate Consulting (October 2022)